
Energy data acquisition: metering and sub-metering
Meters, electrical sub-metering with split-core current transformers and measurement campaigns: reliable data, read over M-Bus, Modbus or BACnet.
Good analysis starts with good measurement
The utility meter tells you how much the building consumes, never where or when. To know what the ventilation, the chillers, the lighting of common areas or a tenant actually cost, you have to measure close to the loads. Without that data, monitoring shows averages and an audit rests on assumptions.
What we measure
- Electricity: sub-metering per outgoing circuit, per end use or per tenant, with voltage, current, power and active and reactive energy.
- Heating and cooling: thermal energy meters on generation, distribution and substations.
- Water and gas: meters with pulse outputs or communicating meters (M-Bus).
- Operating variables: temperatures, run states, operating hours, CO₂: what explains consumption, not just what quantifies it.
Electrical sub-metering without rewiring
Split-core current transformers close around the existing conductors; a multi-channel measurement module on a DIN rail reads several circuits at once. No circuit is disconnected, and installation by a licensed electrical contractor (Swiss Low-Voltage Installation Ordinance, NIV/OIBT) usually requires no prolonged shutdown. As soon as the readings are used for billing, in a self-consumption community (ZEV/RCP) or to recharge service costs, the meters fall under Swiss legal metrology (Measuring Instruments Ordinance, METAS): we take this into account when choosing the hardware.
What sub-metering reveals
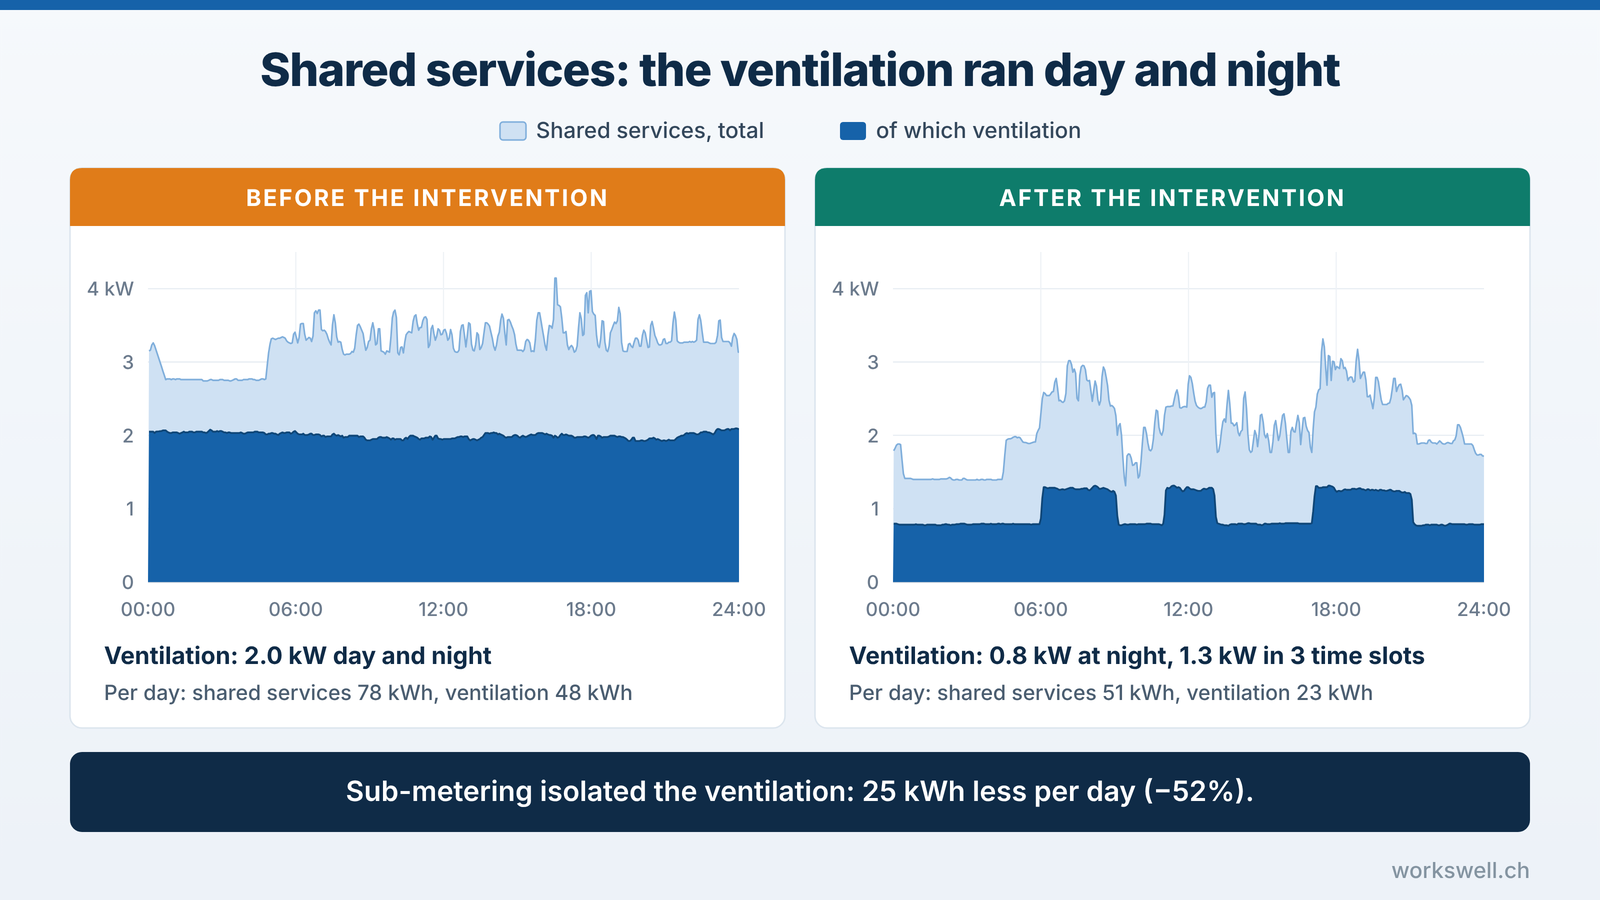
In a condominium building, the shared-services meter showed high consumption without saying where it came from. Sub-metering, which separates the ventilation from the rest of the shared services, brought the cause to light: the air handling unit was running at 2 kW day and night, with no night setback. After the intervention, the ventilation uses 25 kWh less per day. The details: identifying excess consumption in shared services.
Temporary measurement campaigns
Where no meter exists, loggers installed for a few weeks are often enough. They cover working days, nights and weekends, and reveal the base load, the peaks and the installations that never switch off. That is the basis of an energy audit or an investment decision, before permanent meters are installed.
Using what is already there
Many buildings already meter more than they think: M-Bus meters never connected, Modbus or BACnet meters on the controller, pulse outputs, trend logs in the building management system. We integrate them before adding new ones, and we check every point: a current transformer fitted the wrong way round, a forgotten transformer ratio or a wrong pulse value distorts monitoring for years. The sum of the sub-meters is compared with the main meter before the data is used.
A documented metering plan, data that remains yours
Every measuring point is described: location, quantity, unit, protocol, address, factor. Naming follows the KBOB designation of the installations, and the data can be exported in open formats. You can change tool or provider without starting from scratch.
Next: analyse, then act
The data feeds energy monitoring (dashboards, drift alerts), then the energy audit, which turns the deviations observed into a costed action plan.
Another case study: a self-consumption community in Courtelary.
A building to measure, a consumption to understand?
A first conversation is usually enough to gauge the savings potential and the data available.